
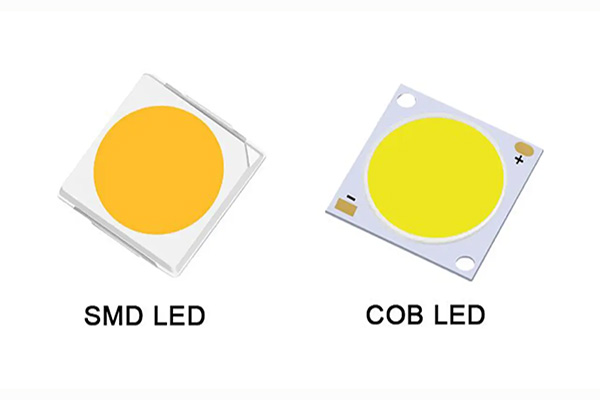
LED COB Display Market: Supply-Demand Imbalance and Growth Opportunities
The Next-Gen Display Tech Revolution

Core Insights at a Glance
- ✅ Capacity Surge: Global COB monthly capacity exceeds 90K㎡ in 2025, yet utilization rates stagnate at 60%-65%.
- ✅ Price Collision: COB average prices plunged 31.4% YoY, triggering industry consolidation.
- ✅ Untapped Markets: Outdoor/rental (¥20B+) and overseas sectors (<15% penetration) offer massive growth potential.
- ✅ Tech Breakthroughs: Virtual pixel algorithms and flip-chip designs cut costs by 30% while boosting reliability.
1. Market Expansion: Rising Amidst Challenges
Chip-on-Board (COB) technology is redefining the global display landscape. In Q1 2025, COB captured 23.6% of the global fine-pitch LED market revenue, with China leading at 32% penetration—an 8.6% YoY increase4. Despite slowing overall demand, shipments for ultra-fine-pitch COB (≤P1.2) skyrocketed by 49.1% YoY3, driven by:
- Yield breakthroughs: Top manufacturers like Unilumin achieved 99.999% mass transfer yield, lifting overall production efficiency to 98%.
- Cost erosion: Prices plummeted to ¥17.2K/㎡, narrowing the gap with traditional SMD solutions.
- Performance edge: Superior reliability, seamless visuals (zero pixelation), and 57% lower maintenance costs versus SMD.

2. Supply-Demand Mismatch: The Core Challenge
2.1 Supply-Side Overheating
Aggressive capacity expansion dominates the COB sector:
- Global monthly capacity will hit 90K㎡ (P1.2 equivalent) in 2025—a 66.7% YoY surge.
- Leaders like ZhaoChi (20K㎡/month) and Zhongqi (10K㎡/month) spearhead investments, with 16+ players entering the fray.
- Regional clusters emerge: Jiangsu’s 500K㎡ annual base and Lampvision’s Zhuzhou industrial park (150K㎡ capacity).
2.2 Demand-Side Constraints
Monthly global consumption sits at ~50K㎡, resulting in 60-65% capacity utilization even at 90% yield rates4. Consequences include:
- Price wars: 70% of manufacturers adopted “volume-for-price” tactics, slashing Q1 2025 fine-pitch LED prices by 11.5%.
- Market consolidation: Top 5 players now control 74.8% share, with 20% of small firms facing obsolescence.
- Revenue-shipment decoupling: Shipment area grew 12.7% while revenue fell 7.9%—a clear sign of commoditization.
3. Growth Opportunities: Four Pathways to Breakthrough
3.1 Spacing Diversification: From Niche to Mainstream
- Micro-pitch dominance: COB commands >75% share in ≤P1.0 markets (e.g., virtual production studios).
- Mid-pitch expansion: P1.5-P2.0 products now contribute 25.9% of shipments, targeting education and retail.
3.2 LED All-in-One Displays: The Blue Ocean
With just 5-8% penetration in all-in-ones, COB’s soft light emission, touch durability, and anti-glare properties make it ideal for:
- Enterprise collaboration: QIAKE’s 135-inch 4K touch panels exemplify seamless hybrid meeting experiences.
- Education digitization: 52.3% of P1.7-P2.0 displays serve vocational schools, where COB’s durability outperforms SMD.
3.3 Outdoor & Rental Markets: The ¥20B+ Frontier
Despite SMD’s stronghold, COB’s potential here hinges on:
- Material innovation: UV-resistant encapsulation and salt-spray-proof coatings (e.g., Unilumin’s outdoor COB line).
- Design simplification: Reducing component counts for P2.0+ spacing to match SMD cost structures.
3.4 Globalization: China’s Export Momentum
- Penetration gap: Overseas COB adoption lags at 15% vs China’s 32%.
- Demand shift: In Q1 2025, international fine-pitch sales surpassed China for the first time (>50% share).
- Brands going global: Unilumin, Leyard target EMEA and ASEAN through infrastructure partnerships (e.g., Belt and Road projects).
4. Technology Evolution: Driving Cost-Performance Gains
| Innovation | Impact | Cost Reduction |
|---|---|---|
| Virtual Pixels | 1 LED drives 4 pixels | P1.2 cost ≈ P1.5 |
| Flip-Chip Design | Eliminates wire bonds, cuts failure by 50% | Maintenance ↓30% |
| EDL Drivers | Dynamic current control | Power use ↓30% |
| Substrate Shift | FR-4 → Aluminum baseplates | Material cost ↓25% |
Source: DISCIEN, RUNTO (2025)
5. Risks and Competition
- Technology rivalry: MiP (Micro LED in Package) now covers P0.6-P2.0 spacing, threatening COB’s high-end positioning.
- Price sensitivity: For P1.5+ markets, COB must achieve ≤1.2x SMD costs to gain share.
- Consumer adoption: >¥100K price tags for COB TVs (e.g., Samsung, Hisense) delay household penetration.
6. Future Outlook: Value Over Volume
Despite short-term oversupply, COB’s fundamentals remain robust:
- Revenue surge: Projected to claim 40% of the fine-pitch market by 2028 (¥18B revenue).
- Tech convergence: ZhaoChi’s Mini COB backlights and HongQi’s AR glasses (3,000 nits, <1W) unlock metaverse applications.
- Sustainability: Unilumin’s UMicro series secured carbon labels, aligning with global ESG mandates.
Strategic Imperative: Winners will leverage:
- Tiered tech deployment: P0.7/P0.9 for premium projects; P1.2/P1.5 for volume-driven segments
- Vertical integration: Education-focused models (12-15% cheaper than commercial units)
- Global channel partnerships: Localized production in Southeast Asia/EU to bypass tariffs
The next three years will determine whether COB transitions from a “capacity race” to “value creation.” Companies mastering quantum-dot COB, outdoor wearables, and early global distribution will dominate the display revolution.
Data Sources: DISCIEN (2025), RUNTO (Q1 2025), Hangjianet Research (2025). For the full report, visit [Global COB Display Whitepaper].
✅ Ready to leverage COB for your next project? [Contact us] WWW.XLY-PCB.COM for a customized cost-benefit analysis!